Gold trading chart live: how to read real-time price action and key levels
Key Takeaways
A live chart is most useful when you read it as part of a plan, not as a signal to react to every tick. Keep the wider structure, nearby levels and the risk of a fast move in view.
- Check whether the chart shows spot gold, XAU/USD or a futures contract before comparing prices.
- Use higher timeframes for context and shorter ones to study entries and reactions.
- Treat support and resistance as zones, then look for confirmation around them.
- Consider the dollar, interest-rate expectations, scheduled news and trading-session conditions.
- Set your invalidation level, stop and position size before entering a trade.
What a live gold trading chart shows
A live gold trading chart shows recent price changes as they happen, but it does not tell you by itself what to do next. First, check which gold price or instrument you are viewing, then understand how the quote is displayed. That groundwork helps you read the chart without mistaking a reference price for the exact price at which you could trade.
Spot gold, XAU/USD and futures prices
Spot gold is commonly quoted as XAU/USD: the value of one troy ounce of gold expressed in US dollars. A futures price relates to a contract for delivery at a specified date, so it can differ from a spot quote. Before comparing two charts, check the instrument and the data source; otherwise, a small difference may be a contract or quotation detail rather than a meaningful move in the market. You can review a live spot-price chart alongside the instrument shown on your own platform.
Bid, ask, spread and the latest price
The bid is the price at which you can sell, while the ask is the price at which you can buy. The difference between them is the spread, and it can change as trading conditions shift. A chart may display the latest trade, a midpoint, or one side of a quote, so do not assume that the visible price is the price your order will receive. The executable quote matters when you are planning a close entry or setting a stop near the market.
Candlesticks, volume and price updates
Each candlestick records the open, high, low and close for its chosen interval. Its body shows the distance between open and close; its wicks show how far price travelled beyond them before the interval ended. If your chart includes volume, read it as additional context rather than a promise that a move will continue: the meaning and coverage of volume depend on the market and data feed. A gold trading basics guide can help you connect chart patterns with the instrument and trading conditions.
A candle is not complete until its interval closes, and an updating candle can change shape as new prices arrive. Keep that distinction in mind when you see a sudden wick or apparent breakout on a live chart. Looking at the close can give you a steadier basis for judging whether price actually held beyond a level.
How to choose a chart timeframe
A timeframe changes the amount of detail you see, not the underlying market. A short interval can make a move look dramatic, while a broader view may show it as a minor reaction within a range. Moving between timeframes lets you ask two different questions: what is the market doing overall, and what is it doing at the level you are watching?
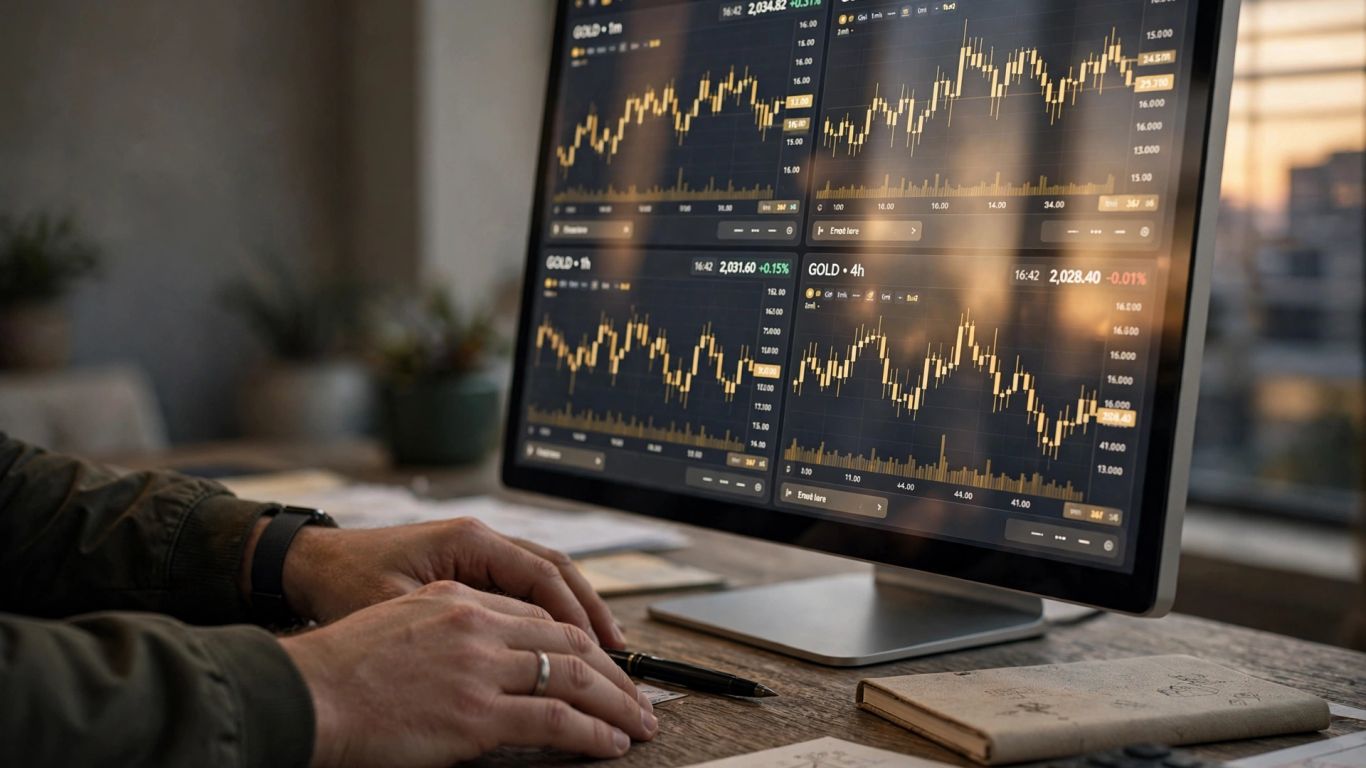
Using higher timeframes to identify the broader trend
Start with a higher timeframe to identify the broad direction, major turning points and areas where price has paused before. Look for sequences of higher highs and higher lows, or lower highs and lower lows, but do not treat one candle as proof of a lasting trend. A wider view can also show whether a move on a shorter chart is pushing into a major barrier or simply continuing through open space.
Reading intraday charts for entries and reactions
Intraday charts can help you examine how price behaves around a level, including whether it is rejected, accepted or crossed quickly. Shorter intervals bring more detail, but they can also make ordinary fluctuations feel like important changes in direction. The table below is a practical starting point; the best setting depends on your plan and how long you expect to hold a position.
| Chart view | Useful for | Watch out for |
|---|---|---|
| Higher timeframe | Broader trend and major zones | Less detail for precise entries |
| Intraday timeframe | Reactions around levels and session moves | Short-lived fluctuations |
| Very short timeframe | Close observation of an entry | Noise and rapid price changes |
Use the broader view to locate the area that matters, then return to the intraday chart to study the reaction there. A small candle on its own should not overrule a clear higher-timeframe structure. If the two views disagree, that is a reason to be selective rather than to force a trade.
Matching the timeframe to your trading approach
Choose a timeframe that fits the time you can give the trade and the distance of your planned stop. A short-term approach may call for closer observation, while a position intended to last longer needs room for ordinary intraday movement. Keep your analysis and execution intervals distinct if that helps: one can define context, the other can help you assess a trigger.
How to read gold price structure
Price structure describes how the market makes and responds to highs and lows. It can help you distinguish a steady directional move from a range, or a genuine change in behaviour from a temporary pullback. You do not need to label every candle; a few clearly marked turning points are usually more useful than a crowded chart.
Identifying higher highs, lower lows and consolidation
A sequence of higher highs and higher lows suggests buyers have been able to push price upwards and defend pullbacks at progressively higher areas. Lower highs and lower lows suggest the opposite. When neither side consistently advances, price may be consolidating within a range. Treat these descriptions as a reading of recent structure, not a forecast that the next move must continue in the same direction.
Marking support and resistance zones
Support and resistance are better treated as areas than as perfectly precise lines. Mark places where price has previously paused, turned, or moved through with force, then consider how price behaves when it returns. A former resistance area may act as support after a clear move above it, but that role is not guaranteed. Look for repeated reactions and use the zone to frame a possible scenario, rather than assuming it will hold.
Understanding breakouts, retests and false moves
A breakout occurs when price moves beyond a range or a marked zone; a retest is a subsequent return towards the area it crossed. A decisive close beyond a level followed by a measured retest may offer clearer evidence than a brief spike through it. False moves happen too, particularly when price quickly returns inside the previous range. You can read the move in sequence: where price closed, what happened on the return, and whether the structure still supports your original idea.
How to combine chart signals with market context
A chart records price action, while market context can help explain why conditions may change. Neither one removes uncertainty: a headline can produce a sharp move, and a strong-looking chart pattern can fail. Build a view from what price is doing and what is scheduled, then decide which developments would strengthen or weaken your scenario.
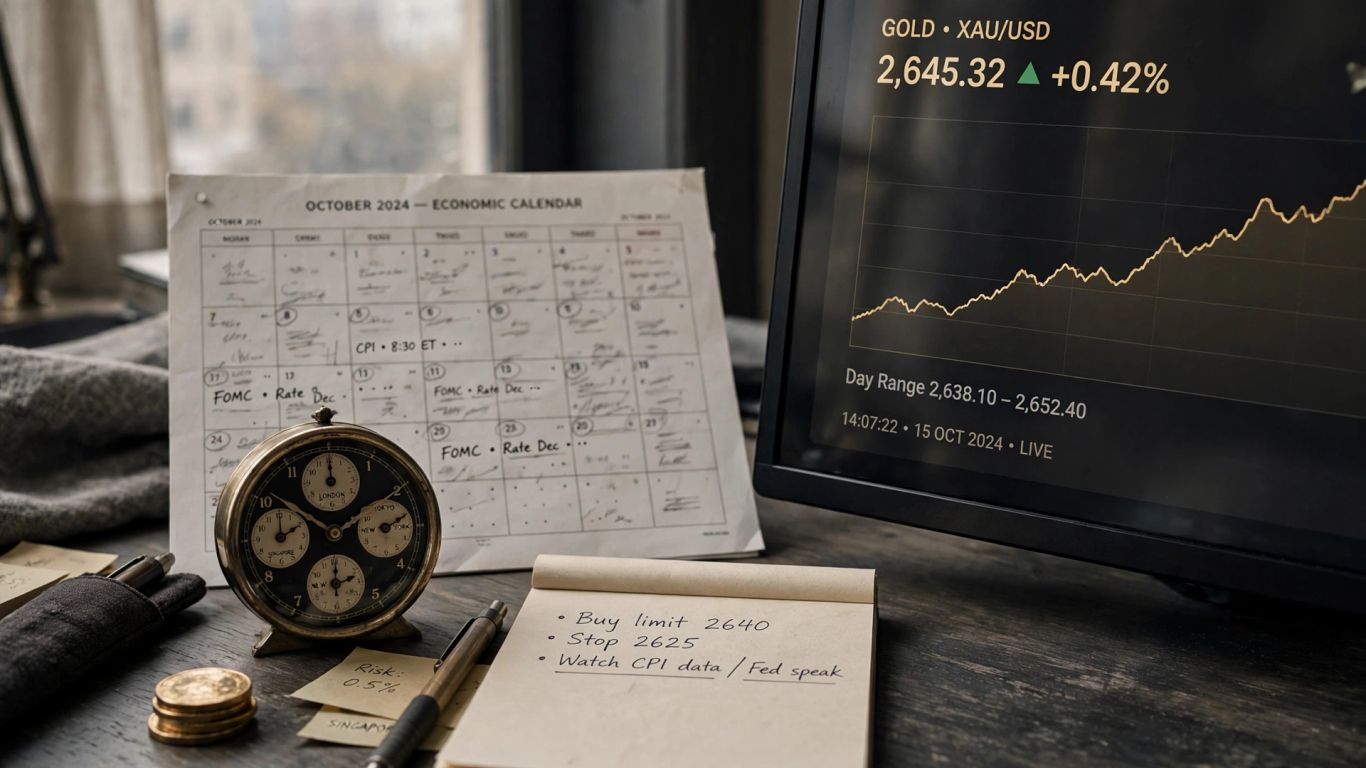
Tracking the US dollar and interest-rate expectations
Gold is commonly priced in US dollars, so changes in the dollar can influence how gold is viewed by buyers using other currencies. Interest-rate expectations matter as well, because shifts in expected policy can change currency and bond-market conditions that gold traders follow. These relationships are not mechanical rules: gold can move for several reasons at once. Watch whether the chart confirms the macro narrative rather than assuming it must follow it.
Checking economic releases and scheduled news
Before trading, check whether an important economic release or central-bank announcement is approaching. Data such as inflation and employment figures can alter expectations quickly, while geopolitical developments may shift demand and sentiment in less predictable ways. For a useful routine, compare the scheduled event with the price structure and your planned risk; the live gold trading news guide covers how to assess market drivers alongside price action.
Accounting for trading sessions and thinner holiday markets
Gold trades across global sessions, and activity can vary between Asian, London and New York hours. A move during a busy period may attract more participation than a similar-looking move in quieter conditions, though session timing alone does not confirm direction. Holidays can bring thinner activity and irregular price action. Be cautious about reading too much into a breakout when fewer participants are active.
How to plan a trade from the live chart
A trade plan turns a chart observation into a decision with clear conditions. It should state what you need to see, where your idea would no longer make sense, and how much you are prepared to risk. That approach also gives you a reason to stand aside when price has already travelled too far or the setup is unclear.
Defining an entry trigger and invalidation level
A trigger is the observable event that would prompt you to consider an entry, such as a close beyond a zone or a confirmed reaction on a retest. The invalidation level is where the reasoning behind the trade no longer holds. Decide on both before entering, and keep them tied to the structure you are trading rather than shifting them simply to avoid accepting a loss.
A compact pre-trade sequence can keep the decision grounded in the chart:
- Identify the higher-timeframe direction or range.
- Mark the nearest relevant support and resistance zones.
- Define the price behaviour that would trigger an entry.
- Set the invalidation level and calculate the position size.
Work through the sequence before placing an order, then check that the trigger has actually occurred. If the invalidation point makes the potential loss too large for your plan, reduce the size or skip the trade. A valid setup does not need to be taken at any cost.
Setting a stop and target around nearby price levels
A stop should sit where your trade idea is invalidated, with enough room to account for normal movement around the level. A target can be planned near the next relevant area, but it should make sense in relation to the distance to your stop. Do not choose a target only because it creates an attractive reward-to-risk number; first ask whether price has a plausible route to reach it.
Waiting for confirmation instead of chasing fast moves
When price accelerates, it can be tempting to enter late for fear of missing the move. But a fast candle can be followed by a sharp pullback, and a late entry may leave little room to place a sensible stop. Decide in advance what confirmation would look like and accept that some moves will happen without you. If you are exploring a funded route, compare account options only after checking that the evaluation conditions fit your trading approach.
How to manage risk in volatile gold markets
Gold can move quickly, and the same volatility that creates opportunity can make losses grow just as fast. Risk management begins before an order is placed: define the amount at stake, account for the spread and consider whether the market is behaving unusually. A careful plan cannot prevent every adverse move, but it can limit how much one decision affects your account.
Adjusting position size to the stop distance
Position size should reflect both the stop distance and the amount you are willing to lose if the stop is reached. If the stop needs to be wider because price is volatile, a smaller position can keep the planned cash risk consistent. Do the calculation before entry, using the instrument’s contract specifications and your account currency. Avoid increasing size just because the chart looks convincing.
GoldFunding evaluations have a 5% daily loss limit and a 12% maximum overall drawdown, according to the published rules. Those account limits are not a substitute for setting your own trade-level risk; a single position can still consume more room than intended if size and stop distance are not considered together. Check the rules that apply to your account before trading.
Preparing for slippage and widening spreads
A stop order does not guarantee an exit at the exact price you selected. During fast conditions or around scheduled news, the available price may move before an order is filled, and spreads can widen. Keep this in mind when placing a stop close to the market, and avoid assuming that a displayed quote fully represents the cost of entering or exiting. If the conditions feel too erratic for your plan, waiting is a reasonable decision.
Reassessing bias when key support or resistance breaks
If price decisively breaks a level that supported your original scenario, reassess rather than defending the old view by habit. Check whether the break holds, whether price returns to the zone, and whether the surrounding structure has changed. A single wick may not be enough to confirm a shift, but repeated acceptance beyond a level is worth taking seriously. Keep your bias conditional on what the chart actually does next.
Explore Funded Trading
If you are looking for access to trading capital, explore GoldFunding’s evaluation routes and read the published rules carefully before deciding whether they suit your approach.
Conclusion
A live gold chart becomes more useful when you read price structure in context and decide in advance what would confirm or invalidate a trade. Use the timeframe that fits your approach, treat levels as zones, and size each position around its stop rather than the excitement of a fast move. Careful preparation will not make the market predictable, but it can make your decisions more deliberate.
Frequently Asked Questions
These answers cover common chart-reading questions, from interpreting timeframes to handling sudden moves. Use them as general guidance, and check your own instrument and trading conditions before acting.
What does XAU/USD mean?
XAU/USD is a common symbol for gold priced in US dollars, typically quoted per troy ounce. Always check the instrument details on the chart you are using.
Is spot gold the same as a gold futures price?
No. Spot gold and futures refer to different types of pricing, and a futures contract has a specified delivery date. The quoted prices can differ.
Which timeframe is best for reading gold?
There is no single best timeframe. Use a higher timeframe to see broader structure and a shorter one to examine entries or reactions, while keeping both aligned with your trading approach.
How can you tell whether gold is trending or consolidating?
A trend often shows a sequence of advancing highs and lows in one direction. Consolidation is a period when price moves within a range without consistent progress either way.
Should support and resistance be drawn as exact prices?
They are usually more practical as zones, since price may react around an area rather than turn at one precise number. Look at how price behaves within and around the zone.
What can cause a sudden move in gold?
Economic releases, changing interest-rate expectations, currency moves and geopolitical developments can all contribute. The cause and its effect can vary, so check both the news and the price action.
Why might a live gold chart differ from my trade price?
A chart may show a last-traded price, midpoint or one side of a quote, while your trade uses the available bid or ask. Spreads, data timing and fast market conditions can also affect the price you receive.